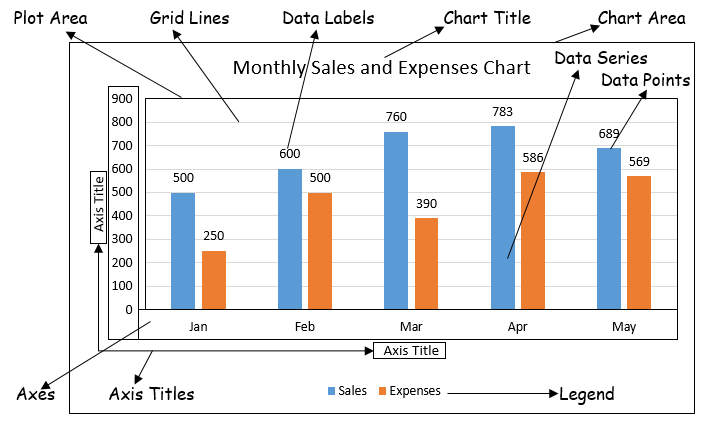
After creating a chart, you can add new chart elements in excel like chart titles, axis titles, legends, data labels, grid lines, etc. Many of them are optional and you always can remove or add them according to your needs, default displays the most essential elements when creating the chart.
You can also change the formatting of existing ones. To format any element of a chart in excel, right-click on the element (bar, line, title, axis, legend, etc.) and select the corresponding option at the bottom of the context menu. This will open a dialog where you can change the selected item.

Table of elements of a chart in Excel
Clicking on the chart brings up the chart with three buttons in the upper right corner of the chart. They are-
 Chart Elements
 Chart Styles and Colors, and
 Chart Filters
With these buttons, we can add elements of a chart in excel, which is checked.

How to add or remove chart elements in Excel?
You may know that most essential elements of the chart appear by default when we create the chart in Excel. If you need to add or remove elements to the chart, click the plus (+) button in the upper right corner of the selected chart (2013 and later versions of Excel). Check to add which you want or uncheck which you want to remove. Or you can also remove chart elements in Excel by simply selecting and deleting them.


Exactly.